Data Collection
|
Data has already been collected concerning the physical dimensions of the canal (bathymetry) at stations every 100 feet along the channel. Although the channel is man-made, the cross-sections vary over its length. Sections have an average bottom width of 65.4 feet, side slope of 2:1, and bank top elevation of 827.1 feet above sea level. The project team obtained, and organized this data. It was determined that additional data collection was not required for the model. Relevant elevations and other available metrics such as engineering drawings were also utilized.
Inflow and OutflowsUnder existing conditions, the canal will overtop due to unsteady flow conditions in the power canal. With wicket gates closed, the canal becomes a 37 million gallon bathtub, which will continue to fill rapidly unless gate configuration is physically altered by the operator. Flows in the power canal may be easily analyzed using a mass balance of water or "water balance," with the control volume being the power canal. This relationship is an application of the conservation of mass:
|
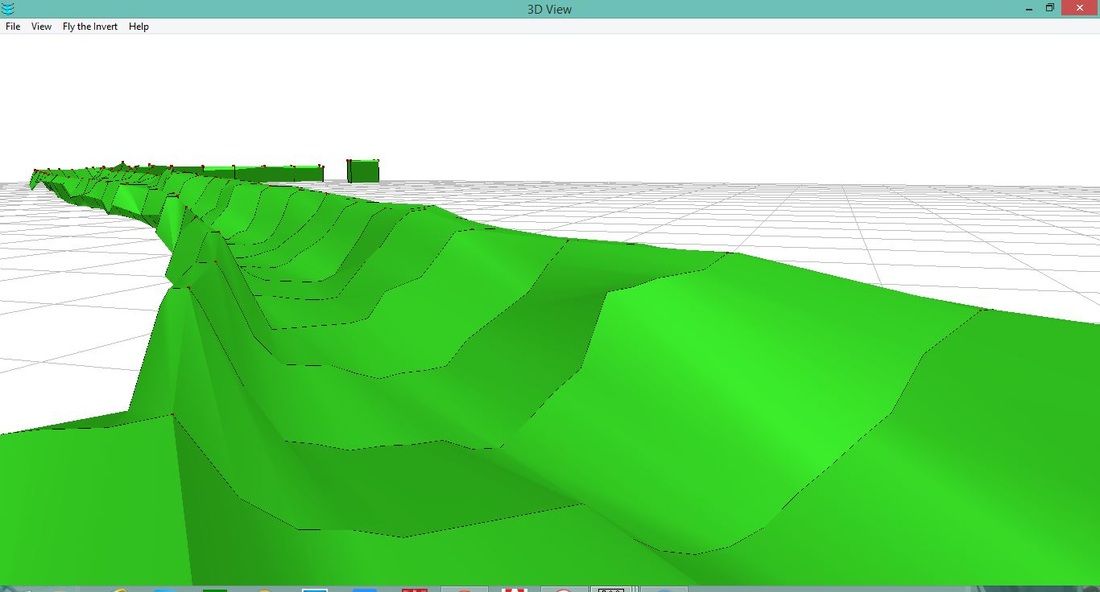
3D animated perspective plot of the power canal under existing conditions, created using the HEC-RAS model. Video highlights three important locations and times where overtopping will occur. Inputs, parameters, timescales, etc. described below.
|
Inflow = Outflow + Accumulation
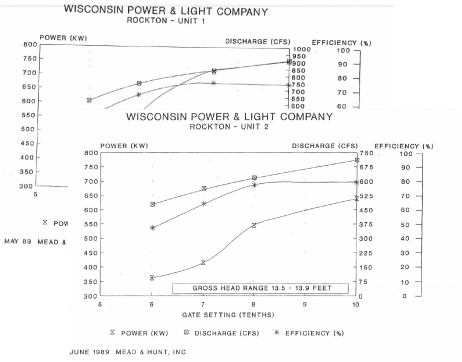
From this relationship, it is clear that outflow must be equal to/less than inflow to prevent overtopping. The maximum allowable outflow (40% open) of the wicket gates is 648 cfs. This value was determined from the maximum flow rate which was found using the power setting charts for each generator (shown below). Unit 1 has a max. discharge of 900 cfs and unit 2 has a max. discharge of 700 cfs, giving a combined maximum hydraulic capacity of 1620 cfs.
Under normal conditions, the powerhouse is operating at as close to 100% (max. power output) as possible, and gates are controlled to maintain a constant water level in the power canal. Inflow equals outflow, which can be assumed approximately 1400-1600 cfs. when powerhouse gates close after a trip, inflow remains constant because head gates remain open. Thus under normal operating conditions, the use of control devices at wicket gates alone will not be sufficient to prevent over-topping. Again, this is because max. inflow (1620 cfs) is much larger than max. allowable outflow (648 cfs).
Although the problem may not be solved using only the wicket gates, having them open automatically after a utility trip could significantly reduce the time required to over-top the canal's banks. This effect was investigated using a model developed (see below, results section)
Currently, overtopping will always occur if action is not taken after a utility trip. Under proposed conditions, overtopping of the canal will never occur if inflow at the headgates is less than or equal to 648 cfs. Unfortunately, conditions like this are uncommon. Based on historical daily USGS surface water data from the station upstream of the Rockton project (USGS 05430500 Rock River at Afton, WI), flows in the Rock river were never that low in the past year (see below). However, historical data suggests that flow rates lower than 648 cfs may occur nearly once per year (see below). However, data from the Afton river monitoring station are lower than what is actually experienced at Rockton. Turtle Creek, Bass Creek, and other tributaries increase flow in the Rock River, suggesting flows will most likley exceed 648 cfs throughout the year. Minimal discharge rates occur in summer and fall months (typically June-October).
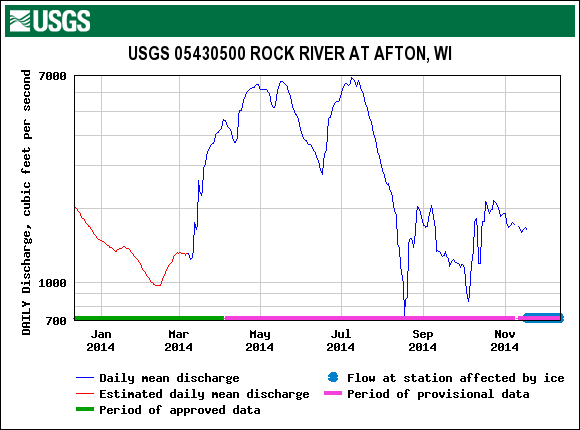
Daily discharge graph for 2014, generated using USGS data from the river monitoring station upstream of Rockton in Afton, WI.
|
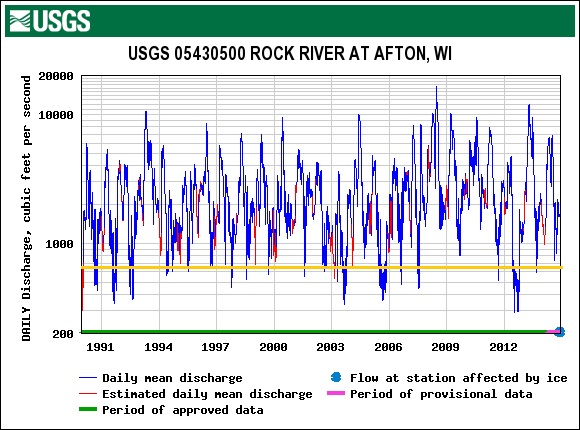
Daily discharge graph for 1989-2014, generated using USGS data from the river monitoring station upstream of Rockton in Afton, WI. The threshold value of 648 cfs is shown by the orange line. This threshold has been reached 21 times over the past 25 years, with historical trends suggesting minimum daily discharge is steadily increasing.
|
HEC - RAS Modeling
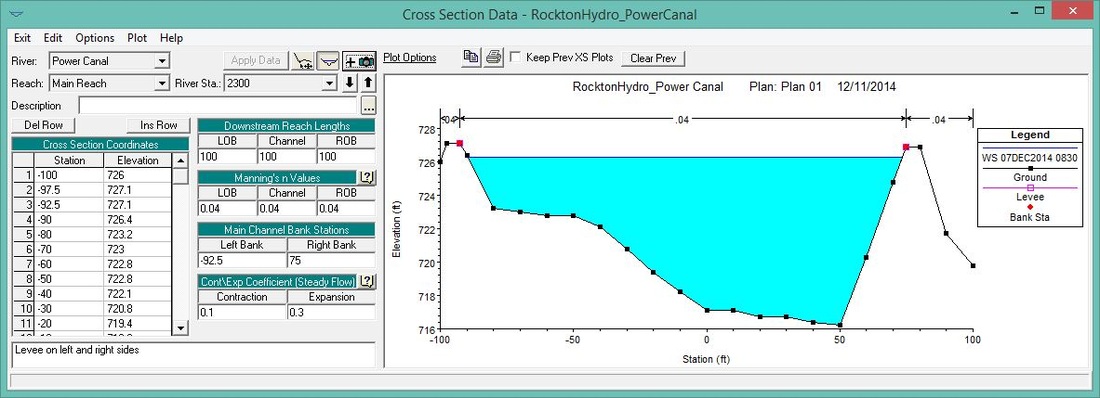
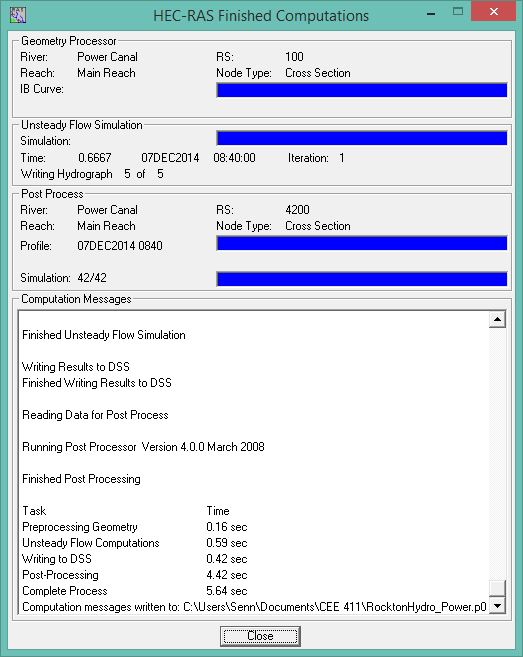
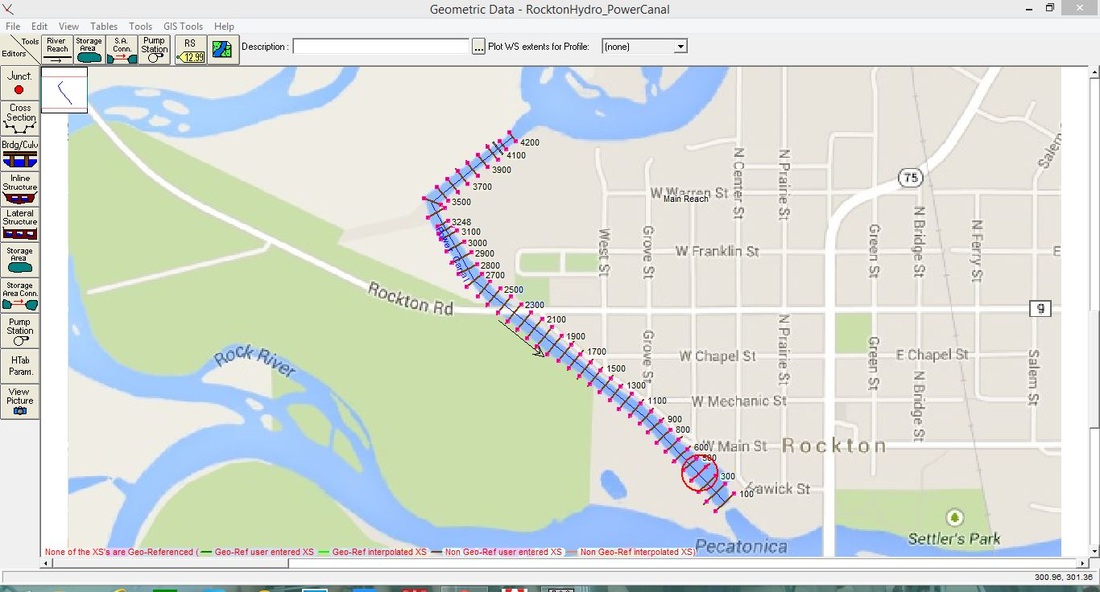
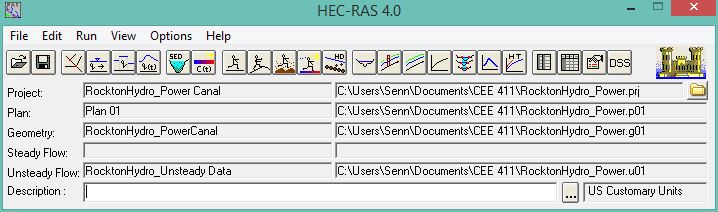
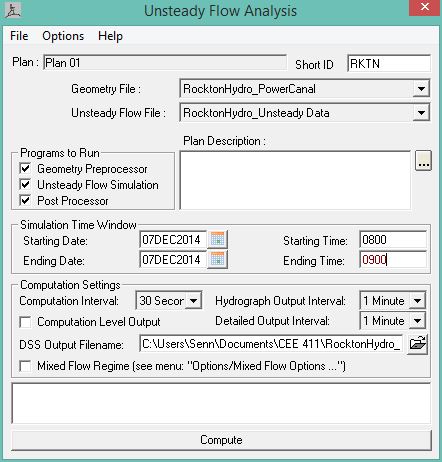
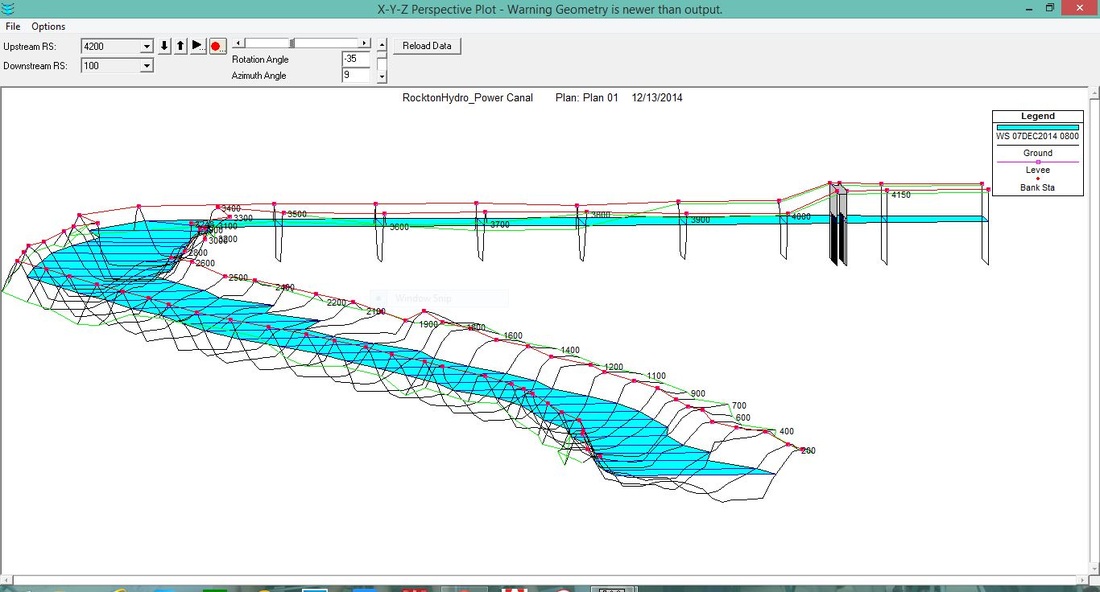
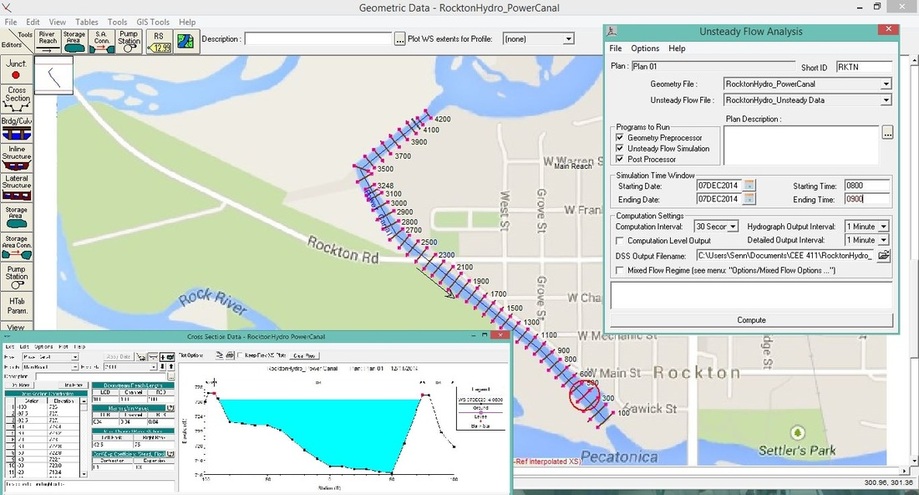 Screenshots from HEC-RAS model used: Large picture showing river reach and cross sections drawn over a map of the site for reference (large picture), input window for a typical cross section (bottom left), and window used to input parameters for the unsteady flow analysis prior to running (top right).
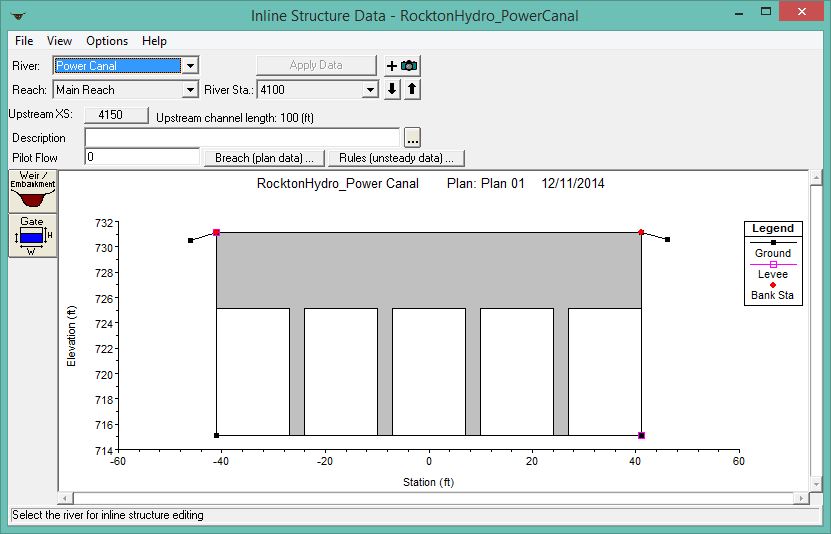
Hydrologic Engineering Center River Analysis System (HEC-RAS) is a software package developed by the U.S. army corps of engineers. It uses energy equations (based on conservation of energy principles) to model and analyze open channel flows under a variety of conditions including steady and unsteady flows. This software is beneficial for educational and professional uses because any number of variables can easily be changed in order to quickly analyze their effect on the system. For modeling the power canal after a utility trip, an unsteady flow analysis was completed (a steady flow analysis would apply to normal conditions before a trip). The model consists of a single reach (Main Reach) of a single river (Power Canal), with 41 cross-sections spaced at 100 feet (see images below). The model also includes an inline structure with five Tainter gates to represent the head gates (dimensions taken from construction drawings), and two additional sections upstream of the head gates. When inputting section data into HEC-RAS, station and elevation data was entered as if looking downstream. The "right" or "left" bank in the model therefore refers to the canal's west or east bank, respectively.
A A Other notable geometric data inputs used in creating the HEC-RAS model include:
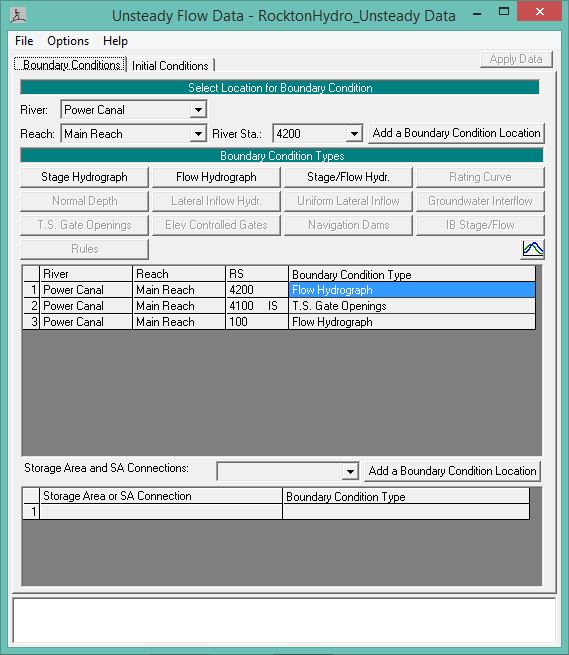
After the model geometry was complete, unsteady flow data had to be entered. This included boundary conditions used by HEC-RAS to solve the energy equations, and can also account for changing flows/flow characteristics over time. Two flow hydrographs were used to define boundary conditions (flows) for the power canal, one located 100 feet upstream of the headgates (42+00), and one located at the powerhouse (0+00). The upstream flow hydrograph was a constant flow, where the downstream hydrograph began equal to upstream (normal operating conditions), then abruptly decreased to a new value (corresponding to a utility trip) of either 0% or 40% initial flow. The 0-40% represents the possible range of wicket gate openings that could be used. A third boundary condition was applied at the headgates themselves (41+00). This condition defined the gate opening height of the Tainter gates with respect to time, allowing the model to analyze scenarios where the headgates can be adjusted. This capability was intended for future use, as the gates currently can not be remotely operated or programmed to move automatically. Gate opening heights of 10 feet (completely open) were used for all scenarios discussed. In the model, headgates are 100% open to reflect a 'worse case' scenario. In reality, the Tainter gates would likely be closed substantially under high flow conditions.
A time scale of 45 minutes was chosen for the model. This time period allowed the canal to overtop in all scenarios analyzed. the computation interval was chosen to be 30 seconds to increase accuracy, and the output intervals were set to 1 minute, the smallest allowable in HEC-RAS. The program processed geometry data, unsteady flow data, and ran a post processor to compute profiles and prepare simulation data. Outputs include section profiles with water surface, reach water profiles, 3D visualizations, and animations (all with respect to time). It is easy to scroll through the simulation time (minute by minute) to determine where and when a cross section will overtop. HEC-RAS also provides detailed data in tabular form.
Additional screenshots from HEC-RAS model:
A A Other notable geometric data inputs used in creating the HEC-RAS model include:
- Downstream reach lengths, which give HEC-RAS information about the meandering characteristics of a reach, were typically 100,100,100 for ROB,channel, and LOB. This reflects how the power canal is generally straight. At locations where there is a bend in the canal, reach lengths for ROB and LOB (right/left outer bank stations) were estimated using scaled drawings of the power canal.
- Manning's n value of 0.04 was assumed for the entire channel, which is in the upper range for clean straight natural main channel with weeds and stones. The large amount of submerged debris along the channel (including logs, tree stumps, etc) will cause this value to be higher than normal. However, the flows being studied in the canal are so large that friction will not have a significant effect on filling behavior of the channel. ROB and LOB n values were also set to 0.04, but have no affect because flow is not being analyzed in those locations.
- Main channel bank stations were defined by the highest elevation in the section on either side of the center line. The model was also configured so that the banks acted as levees (preventing flow from infiltrating through prior to overtopping), with bank stations marking the levees at each cross section. In reality, a small amount of flow through the channel banks will occur, but this flow has been assumed to be negligible for the purposes of the model.
- Expansion and contraction coefficients were set at 0.3 and 0.1, respectively. These values were chosen because they represent typical coefficients for subcritical flows with gradual transitions. These coefficients are used by HEC-RAS to compute energy losses due to changes in channel geometry.
After the model geometry was complete, unsteady flow data had to be entered. This included boundary conditions used by HEC-RAS to solve the energy equations, and can also account for changing flows/flow characteristics over time. Two flow hydrographs were used to define boundary conditions (flows) for the power canal, one located 100 feet upstream of the headgates (42+00), and one located at the powerhouse (0+00). The upstream flow hydrograph was a constant flow, where the downstream hydrograph began equal to upstream (normal operating conditions), then abruptly decreased to a new value (corresponding to a utility trip) of either 0% or 40% initial flow. The 0-40% represents the possible range of wicket gate openings that could be used. A third boundary condition was applied at the headgates themselves (41+00). This condition defined the gate opening height of the Tainter gates with respect to time, allowing the model to analyze scenarios where the headgates can be adjusted. This capability was intended for future use, as the gates currently can not be remotely operated or programmed to move automatically. Gate opening heights of 10 feet (completely open) were used for all scenarios discussed. In the model, headgates are 100% open to reflect a 'worse case' scenario. In reality, the Tainter gates would likely be closed substantially under high flow conditions.
A time scale of 45 minutes was chosen for the model. This time period allowed the canal to overtop in all scenarios analyzed. the computation interval was chosen to be 30 seconds to increase accuracy, and the output intervals were set to 1 minute, the smallest allowable in HEC-RAS. The program processed geometry data, unsteady flow data, and ran a post processor to compute profiles and prepare simulation data. Outputs include section profiles with water surface, reach water profiles, 3D visualizations, and animations (all with respect to time). It is easy to scroll through the simulation time (minute by minute) to determine where and when a cross section will overtop. HEC-RAS also provides detailed data in tabular form.
Additional screenshots from HEC-RAS model:
Results
Given typical operating conditions, the model was run under two scenarios:
- Existing conditions were reflected by setting outflow at the powerhouse to zero. This represents the wicket gates closed after a utility trip.
- Proposed scenario, where powerhouse gates have been programmed to automatically open the maximum synchronous speed. This is 40% of the maximum operating opening.
|
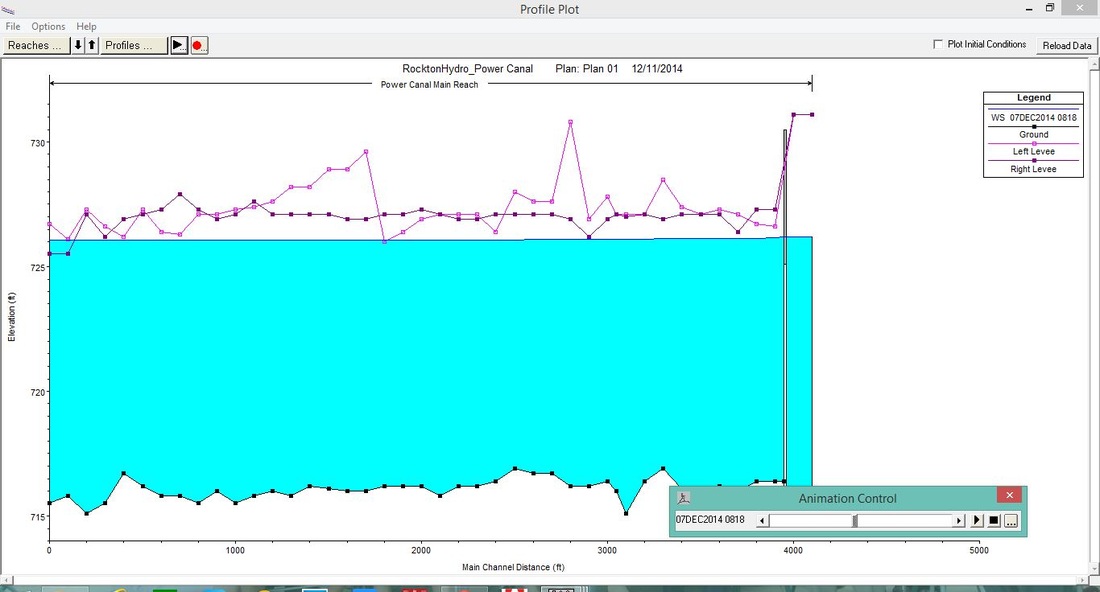
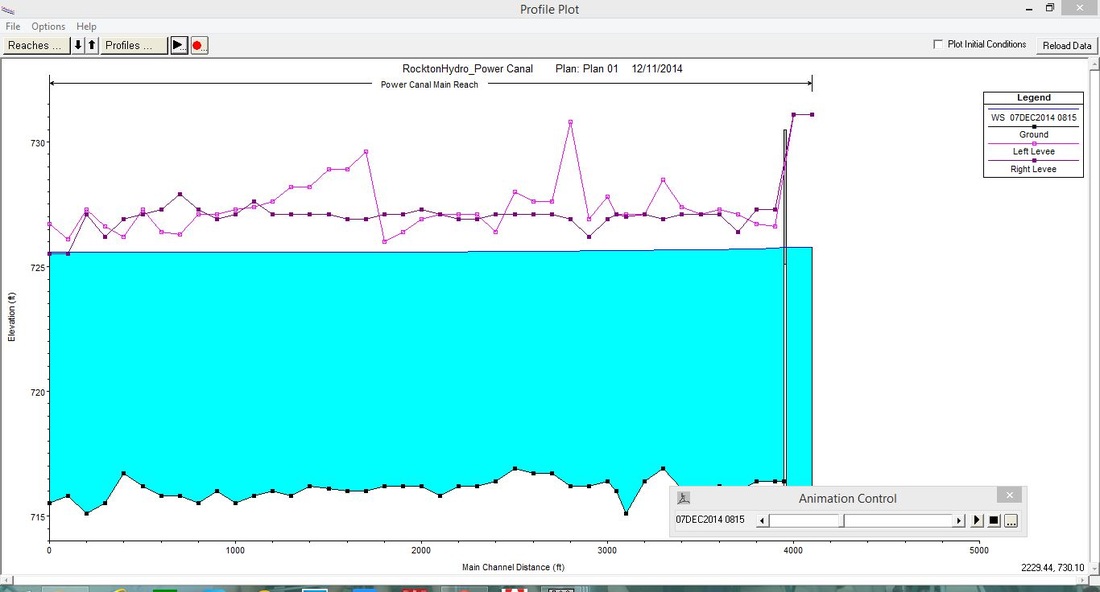
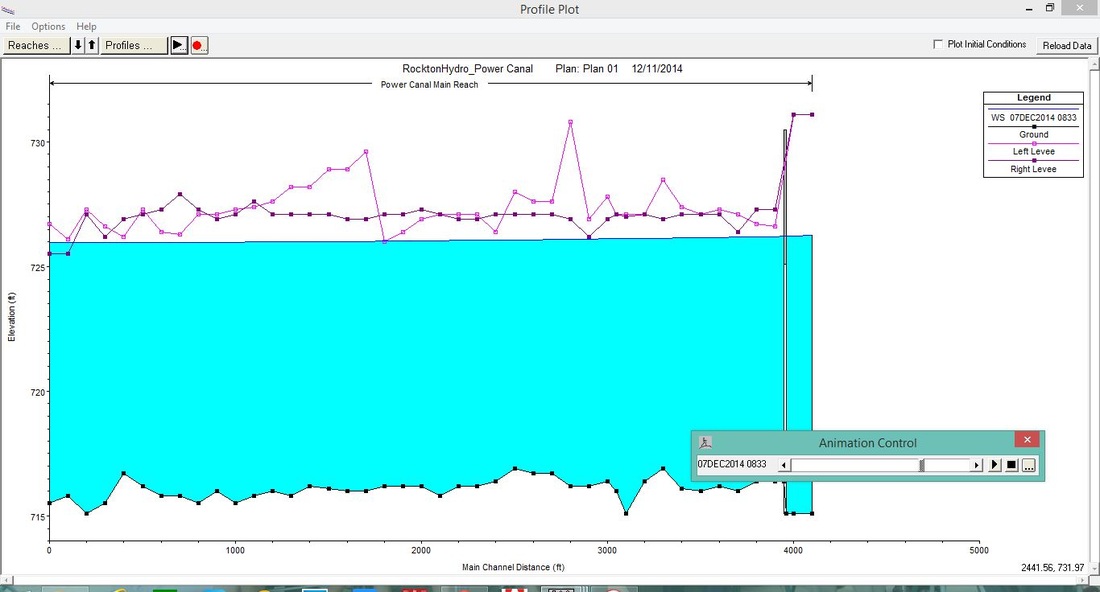
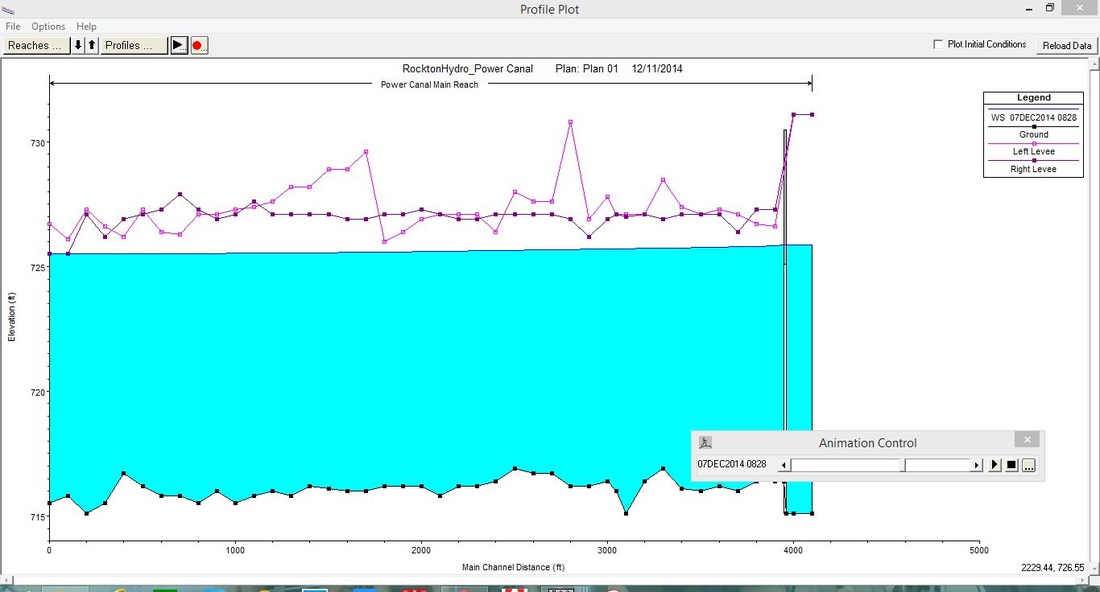
Animated HEC-RAS profile plot representing existing conditions (powerhouse gates close completely after utility trip)
|
Animated HEC-RAS profile plot representing proposed conditions where powerhouse gates are automatically opened to 40% of full after utility trip
|
|
|
Frame-by-frame analysis of the model at each cross section over the time interval showed the exact locations where overtopping will occur, as well as giving information about when this will occur. It was determined that the overtopping will occur at sta 1+00 (right bank), 19+00 (left bank), and 30+00 (right bank) in that order. (looking downstream) Based on the Model described, the following useful information regarding the canal overtopping was obtained: Time to Overtop after Utility Trip by Location (min) Scenario: 0% 40% 100% 1+00 R 16 28 N/A 19+00 L 19 33 N/A 30+00 R 21 35 N/A |